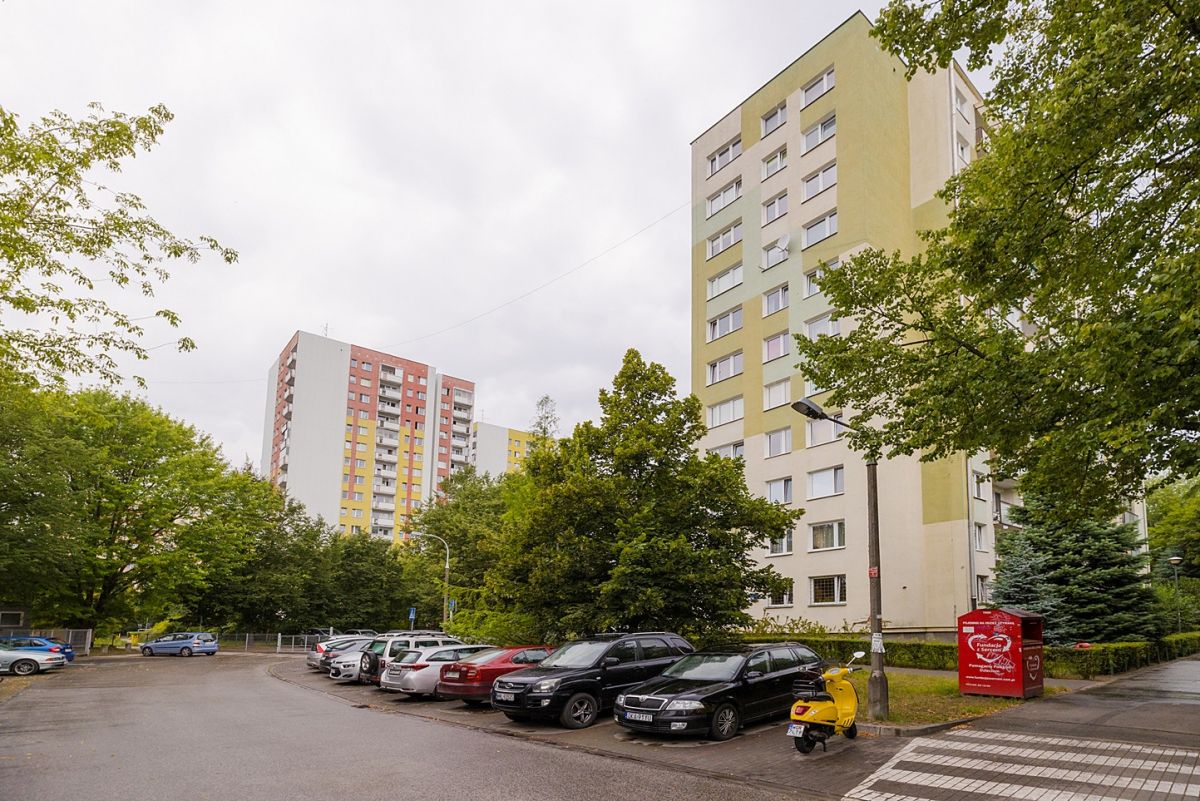
Change in the population of Warsaw for the period 1981 - 2021

Change in the population of Warsaw for the period 1981 - 2021
(Total, including men and women, thousand people)
1981 ...... 1611,6 752,4 859,2
1982 ...... 1628,9 760,9 868,0
1983 ...... 1641,3 766,7 874,6
1984 ...... 1649,1 770,6 878,5
1985 ...... 1659,4 776,8 882,6
1986 ...... 1664,7 779,2 885,5
1987 .......1671,4 782,5 888,9
1988 ...... 1651,2 772,3 878,9
1989 .......1651,2 772,4 878,8
1990 .......1655,7 773,1 882,6
1991 ...... 1653,3 771,9 881,4
1992 .......1644,5 763,3 881,2
1993 .......1642,7 762,3 880,4
1994 ...... 1640,7 760,7 880,0
1995 .......1635,1 757,9 877,2
1996 .......1628,5 754,2 874,3
1997 .......1624,8 752,2 872,6
1998 ...... 1618,5 748,5 870,0
1999 .......1615,4 747,2 868,2
2000 .......1672,4 774,7 897,7
2001 ...... 1671,7 773,8 898,0
2002 .......1688,2 780,9 907,3
2003 ...... 1689,6 780,4 909,2
2004 .......1692,9 781,6 911,3
2005 .......1697,6 782,3 915,3
2006 .......1702,1 783,5 918,7
2007 .......1706,6 784,8 921,8
2008 .......1709,8 786,3 923,5
2009 .......1714,4 787,9 926,5
2010 ...... 1700,1 780,3 919,8
2011 .......1708,5 783,8 924,7
2012 .......1715,5 786,9 928,6
2013 .......1724,4 791,2 933,2
2014 .......1735,4 796,2 939,3
2015 .......1744,4 800,8 943,6
2016 .......1754,0 805,4 948,6
2017 .......1764,6 810,8 953,8
2018 .......1778,0 817,7 960,3
2019 .......1790,7 824,3 966,3
2020 .......1861,8 858,8 1003,0
2021 .......1863,1 859,7 1003,4
Blog

The Cost of Apartment Renovation in Poland
The Cost of Apartment Renovation in Poland

What to expect on the Polish rental property market in 2024
What to expect on the Polish rental property market in 2024


