1981 - 2021 dönemi için Varşova nüfusunun değişimi

1981 - 2021 dönemi için Varşova nüfusunun değişimi
(Toplam, kadın erkek dahil bin kişi)
1981 ...... 1611,6 752,4 859,2
1982 ...... 1628,9 760,9 868,0
1983 ...... 1641,3 766,7 874,6
1984 ...... 1649,1 770,6 878,5
1985 ...... 1659,4 776,8 882,6
1986 ...... 1664,7 779,2 885,5
1987 .......1671,4 782,5 888,9
1988 ...... 1651,2 772,3 878,9
1989 .......1651,2 772,4 878,8
1990 .......1655,7 773,1 882,6
1991 ...... 1653,3 771,9 881,4
1992 .......1644,5 763,3 881,2
1993 .......1642,7 762,3 880,4
1994 ...... 1640,7 760,7 880,0
1995 .......1635,1 757,9 877,2
1996 .......1628,5 754,2 874,3
1997 .......1624,8 752,2 872,6
1998 ...... 1618,5 748,5 870,0
1999 .......1615,4 747,2 868,2
2000 .......1672,4 774,7 897,7
2001 ...... 1671,7 773,8 898,0
2002 .......1688,2 780,9 907,3
2003 ...... 1689,6 780,4 909,2
2004 .......1692,9 781,6 911,3
2005 .......1697,6 782,3 915,3
2006 .......1702,1 783,5 918,7
2007 .......1706,6 784,8 921,8
2008 .......1709,8 786,3 923,5
2009 .......1714,4 787,9 926,5
2010 ...... 1700,1 780,3 919,8
2011 .......1708,5 783,8 924,7
2012 .......1715,5 786,9 928,6
2013 .......1724,4 791,2 933,2
2014 .......1735,4 796,2 939,3
2015 .......1744,4 800,8 943,6
2016 .......1754,0 805,4 948,6
2017 .......1764,6 810,8 953,8
2018 .......1778,0 817,7 960,3
2019 .......1790,7 824,3 966,3
2020 .......1861,8 858,8 1003,0
2021 .......1863,1 859,7 1003,4
Blog


Polska w rankingu Indeksu Odpowiedzialnego Rozwoju
Polska w rankingu Indeksu Odpowiedzialnego Rozwoju

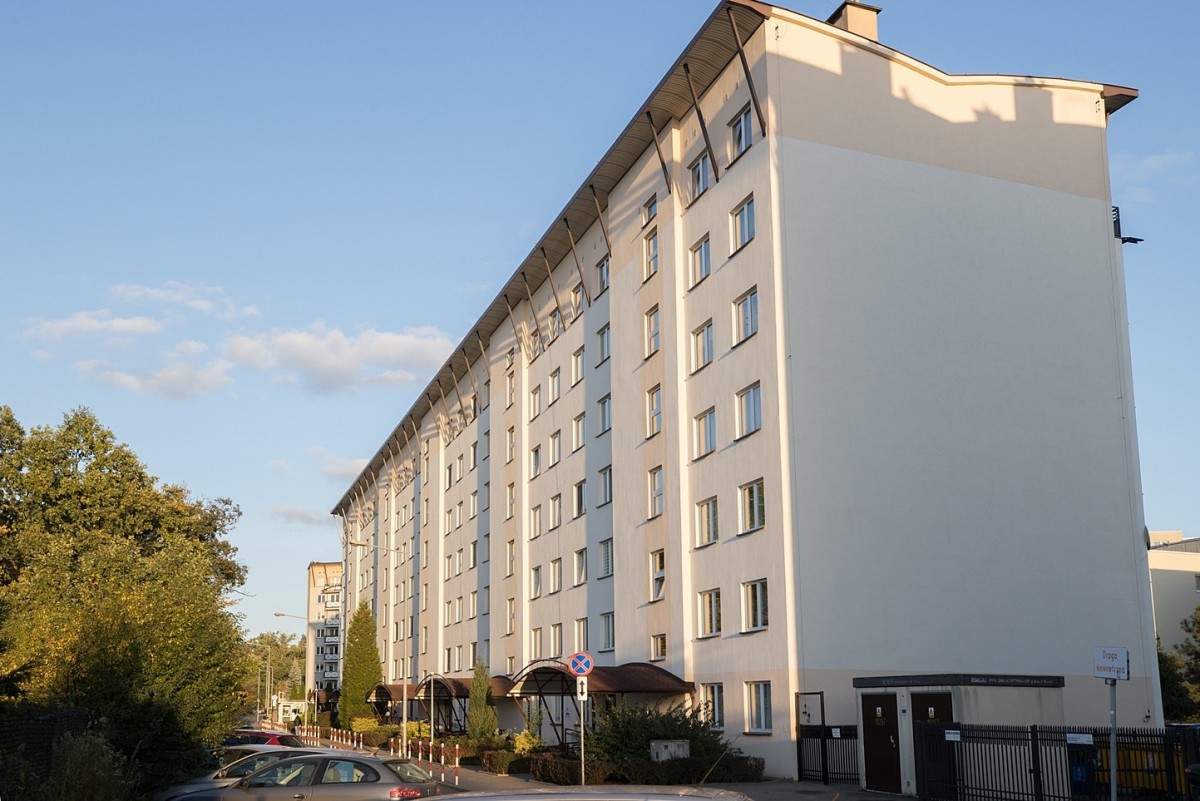
Budynek wyposażony w centralne ogrzewanie
Budynek wyposażony w centralne ogrzewanie


