Change in prices for residential real estate in Warsaw in 2006 - 2021

Change in prices for residential real estate in Warsaw in 2006 - 2021
Over the past 15 years, the value of real estate in the Polish capital has almost doubled. The table below shows how the dynamics of housing prices in Warsaw changed quarterly for the period 2006 - 2021. In the last 3 years, there has been a steady increase in both the offers of sellers and the increase in sales prices (transactions, deals). This applies to both the primary and secondary real estate markets in Warsaw.
Table. Data on the quarterly change in prices for residential real estate in Warsaw for the period 2006 - 2021 (PLN/sq.m)
|
Quarter |
Primary market |
|
Secondary market |
|
|
|
|
|
|
Offers |
Sales |
Offers |
Sales |
Hedonic Price Index (Q./prev.Q.)* |
Hedonic Price Index (Q./ сor.Q.)** |
|
|
III 2006 |
5 873 |
5 605 |
7 179 |
6 232 |
|
|
|
|
IV 2006 |
6 095 |
6 186 |
8 751 |
7 143 |
121,9 |
|
|
|
I 2007 |
7 509 |
7 302 |
9 316 |
7 730 |
109,7 |
|
|
|
II 2007 |
8 000 |
7 523 |
9 740 |
8 696 |
109,5 |
|
|
|
III 2007 |
8 740 |
7 879 |
10 078 |
9 137 |
106,1 |
155,5 |
|
|
IV 2007 |
9 561 |
8 571 |
9 952 |
9 034 |
98,7 |
125,9 |
|
|
I 2008 |
9 427 |
8 535 |
9 850 |
8 921 |
99,0 |
113,6 |
|
|
II 2008 |
9 300 |
8 611 |
9 783 |
8 546 |
97,7 |
101,3 |
|
|
III 2008 |
9 235 |
8 325 |
9 679 |
8 528 |
102,1 |
97,5 |
|
|
IV 2008 |
9 821 |
8 149 |
10 196 |
9 046 |
99,1 |
97,8 |
|
|
I 2009 |
9 880 |
7 543 |
9 626 |
8 406 |
92,8 |
91,8 |
|
|
II 2009 |
9 859 |
7 461 |
10 133 |
8 406 |
101,4 |
95,2 |
|
|
III 2009 |
9 993 |
7 585 |
9 705 |
7 949 |
99,1 |
92,5 |
|
|
IV 2009 |
9 915 |
7 680 |
9 671 |
8 497 |
100,5 |
93,8 |
|
|
I 2010 |
9 119 |
8 173 |
9 901 |
8 620 |
102,8 |
103,8 |
|
|
II 2010 |
8 551 |
7 974 |
9 982 |
8 933 |
101,0 |
103,3 |
|
|
III 2010 |
8 295 |
7 940 |
9 788 |
8 493 |
97,8 |
101,9 |
|
|
IV 2010 |
8 133 |
7 441 |
9 767 |
8 024 |
100,0 |
101,5 |
|
|
I 2011 |
8 211 |
8 037 |
9 706 |
7 915 |
98,3 |
97,1 |
|
|
II 2011 |
8 396 |
7 527 |
9 472 |
7 920 |
100,6 |
96,7 |
|
|
III 2011 |
8 025 |
7 423 |
9 397 |
7 920 |
100,3 |
99,2 |
|
|
IV 2011 |
7 826 |
7 226 |
9 363 |
7 889 |
99,0 |
98,2 |
|
|
I 2012 |
7 879 |
6 967 |
9 111 |
7 601 |
99,5 |
99,3 |
|
|
II 2012 |
8 123 |
7 043 |
9 035 |
7 522 |
98,4 |
97,1 |
|
|
III 2012 |
7 875 |
6 757 |
8 900 |
7 247 |
99,1 |
96,0 |
|
|
IV 2012 |
7 695 |
6 466 |
8 768 |
7 238 |
97,6 |
94,6 |
|
|
I 2013 |
8 076 |
6 990 |
8 606 |
6 687 |
98,9 |
94,1 |
|
|
II 2013 |
8 081 |
7 018 |
8 638 |
6 867 |
95,8 |
91,6 |
|
|
III 2013 |
8 146 |
7 173 |
8 544 |
6 971 |
103,0 |
95,2 |
|
|
IV 2013 |
8 088 |
7 427 |
8 627 |
7 189 |
100,9 |
98,5 |
|
|
I 2014 |
8 005 |
7 298 |
8 622 |
7 170 |
98,8 |
98,4 |
|
|
II 2014 |
7 924 |
7 316 |
8 691 |
7 332 |
100,0 |
102,8 |
|
|
III 2014 |
7 819 |
7 446 |
8 626 |
7 365 |
102,4 |
102,2 |
|
|
IV 2014 |
7 691 |
7 315 |
8 636 |
7 387 |
100,9 |
102,1 |
|
|
I 2015 |
7 839 |
7 396 |
8 608 |
7 335 |
98,7 |
102,0 |
|
|
II 2015 |
7 872 |
7 510 |
8 553 |
7 308 |
101,6 |
103,5 |
|
|
III 2015 |
7 807 |
7 557 |
8 565 |
7 447 |
97,3 |
98,3 |
|
|
IV 2015 |
7 789 |
7 462 |
8 655 |
7 401 |
103,2 |
100,5 |
|
|
I 2016 |
7 878 |
7 639 |
8 658 |
7 434 |
98,6 |
100,5 |
|
|
II 2016 |
7 649 |
7 583 |
8 721 |
7 355 |
102,4 |
101,3 |
|
|
III 2016 |
7 772 |
7 696 |
8 778 |
7 309 |
101,5 |
105,7 |
|
|
IV 2016 |
7 638 |
7 686 |
8 709 |
7 556 |
98,6 |
101,0 |
|
|
I 2017 |
7 707 |
7 562 |
8 816 |
7 429 |
102,9 |
105,4 |
|
|
II 2017 |
7 740 |
7 683 |
8 885 |
7 821 |
99,7 |
102,6 |
|
|
III 2017 |
7 788 |
7 820 |
9 009 |
8 020 |
100,8 |
102,0 |
|
|
IV 2017 |
8 020 |
7 751 |
9 235 |
8 054 |
102,3 |
105,8 |
|
|
I 2018 |
8 201 |
7 965 |
9 346 |
8 047 |
101,2 |
104,1 |
|
|
II 2018 |
8 611 |
8 183 |
9 347 |
8 394 |
100,6 |
105,0 |
|
|
III 2018 |
8 888 |
8 538 |
9 612 |
8 604 |
101,1 |
105,2 |
|
|
IV 2018 |
9 020 |
8 565 |
10 277 |
8 762 |
104,3 |
107,3 |
|
|
I 2019 |
9 427 |
8 771 |
10 287 |
8 985 |
101,3 |
107,4 |
|
|
II 2019 |
9 591 |
8 932 |
10 575 |
9 243 |
101,6 |
108,5 |
|
|
III 2019 |
9 935 |
9 188 |
10 816 |
9 457 |
104,2 |
111,8 |
|
|
IV 2019 |
10 280 |
9 476 |
11 192 |
9 812 |
102,8 |
110,3 |
|
|
I 2020 |
10 610 |
9 819 |
11 656 |
10 003 |
102,1 |
111,0 |
|
|
II 2020 |
10 717 |
9 438 |
11 521 |
10 288 |
101,0 |
110,4 |
|
|
III 2020 |
10 735 |
10 183 |
11 713 |
10 470 |
99,2 |
105,1 |
|
|
IV 2020 |
10 750 |
10 240 |
11 893 |
10 671 |
105,0 |
107,4 |
|
|
I 2021 |
10 969 |
10 666 |
12 217 |
10 838 |
100,4 |
105,7 |
|
|
II 2021 |
11 359 |
10 671 |
12 473 |
10 576 |
103,8 |
108,7 |
|
|
III 2021 |
11 406 |
10 992 |
12 950 |
10 905 |
101,2 |
110,8 |
|
Note
Existing market data includes hedonic house price indices. These indicators reflect the "net" change in prices, i.e. cleared of qualitative changes (for example, an increase or decrease in the share of more expensive housing). The hedonic index takes into account changes in the quality of housing in the study sample in each of the quarters, which differs from the index of simple dynamics, that is, the average price or median.
*Hedonic price index per square meter of housing (quarter-to-previous quarter dynamics) Hedonic Price Index (Q./prev.Q.)
**Hedonic price index per square meter of housing (quarterly dynamics compared to the corresponding quarter of the previous year) Hedonic Price Index (Q./сor.Q.)
Blog


Nowe Miasto
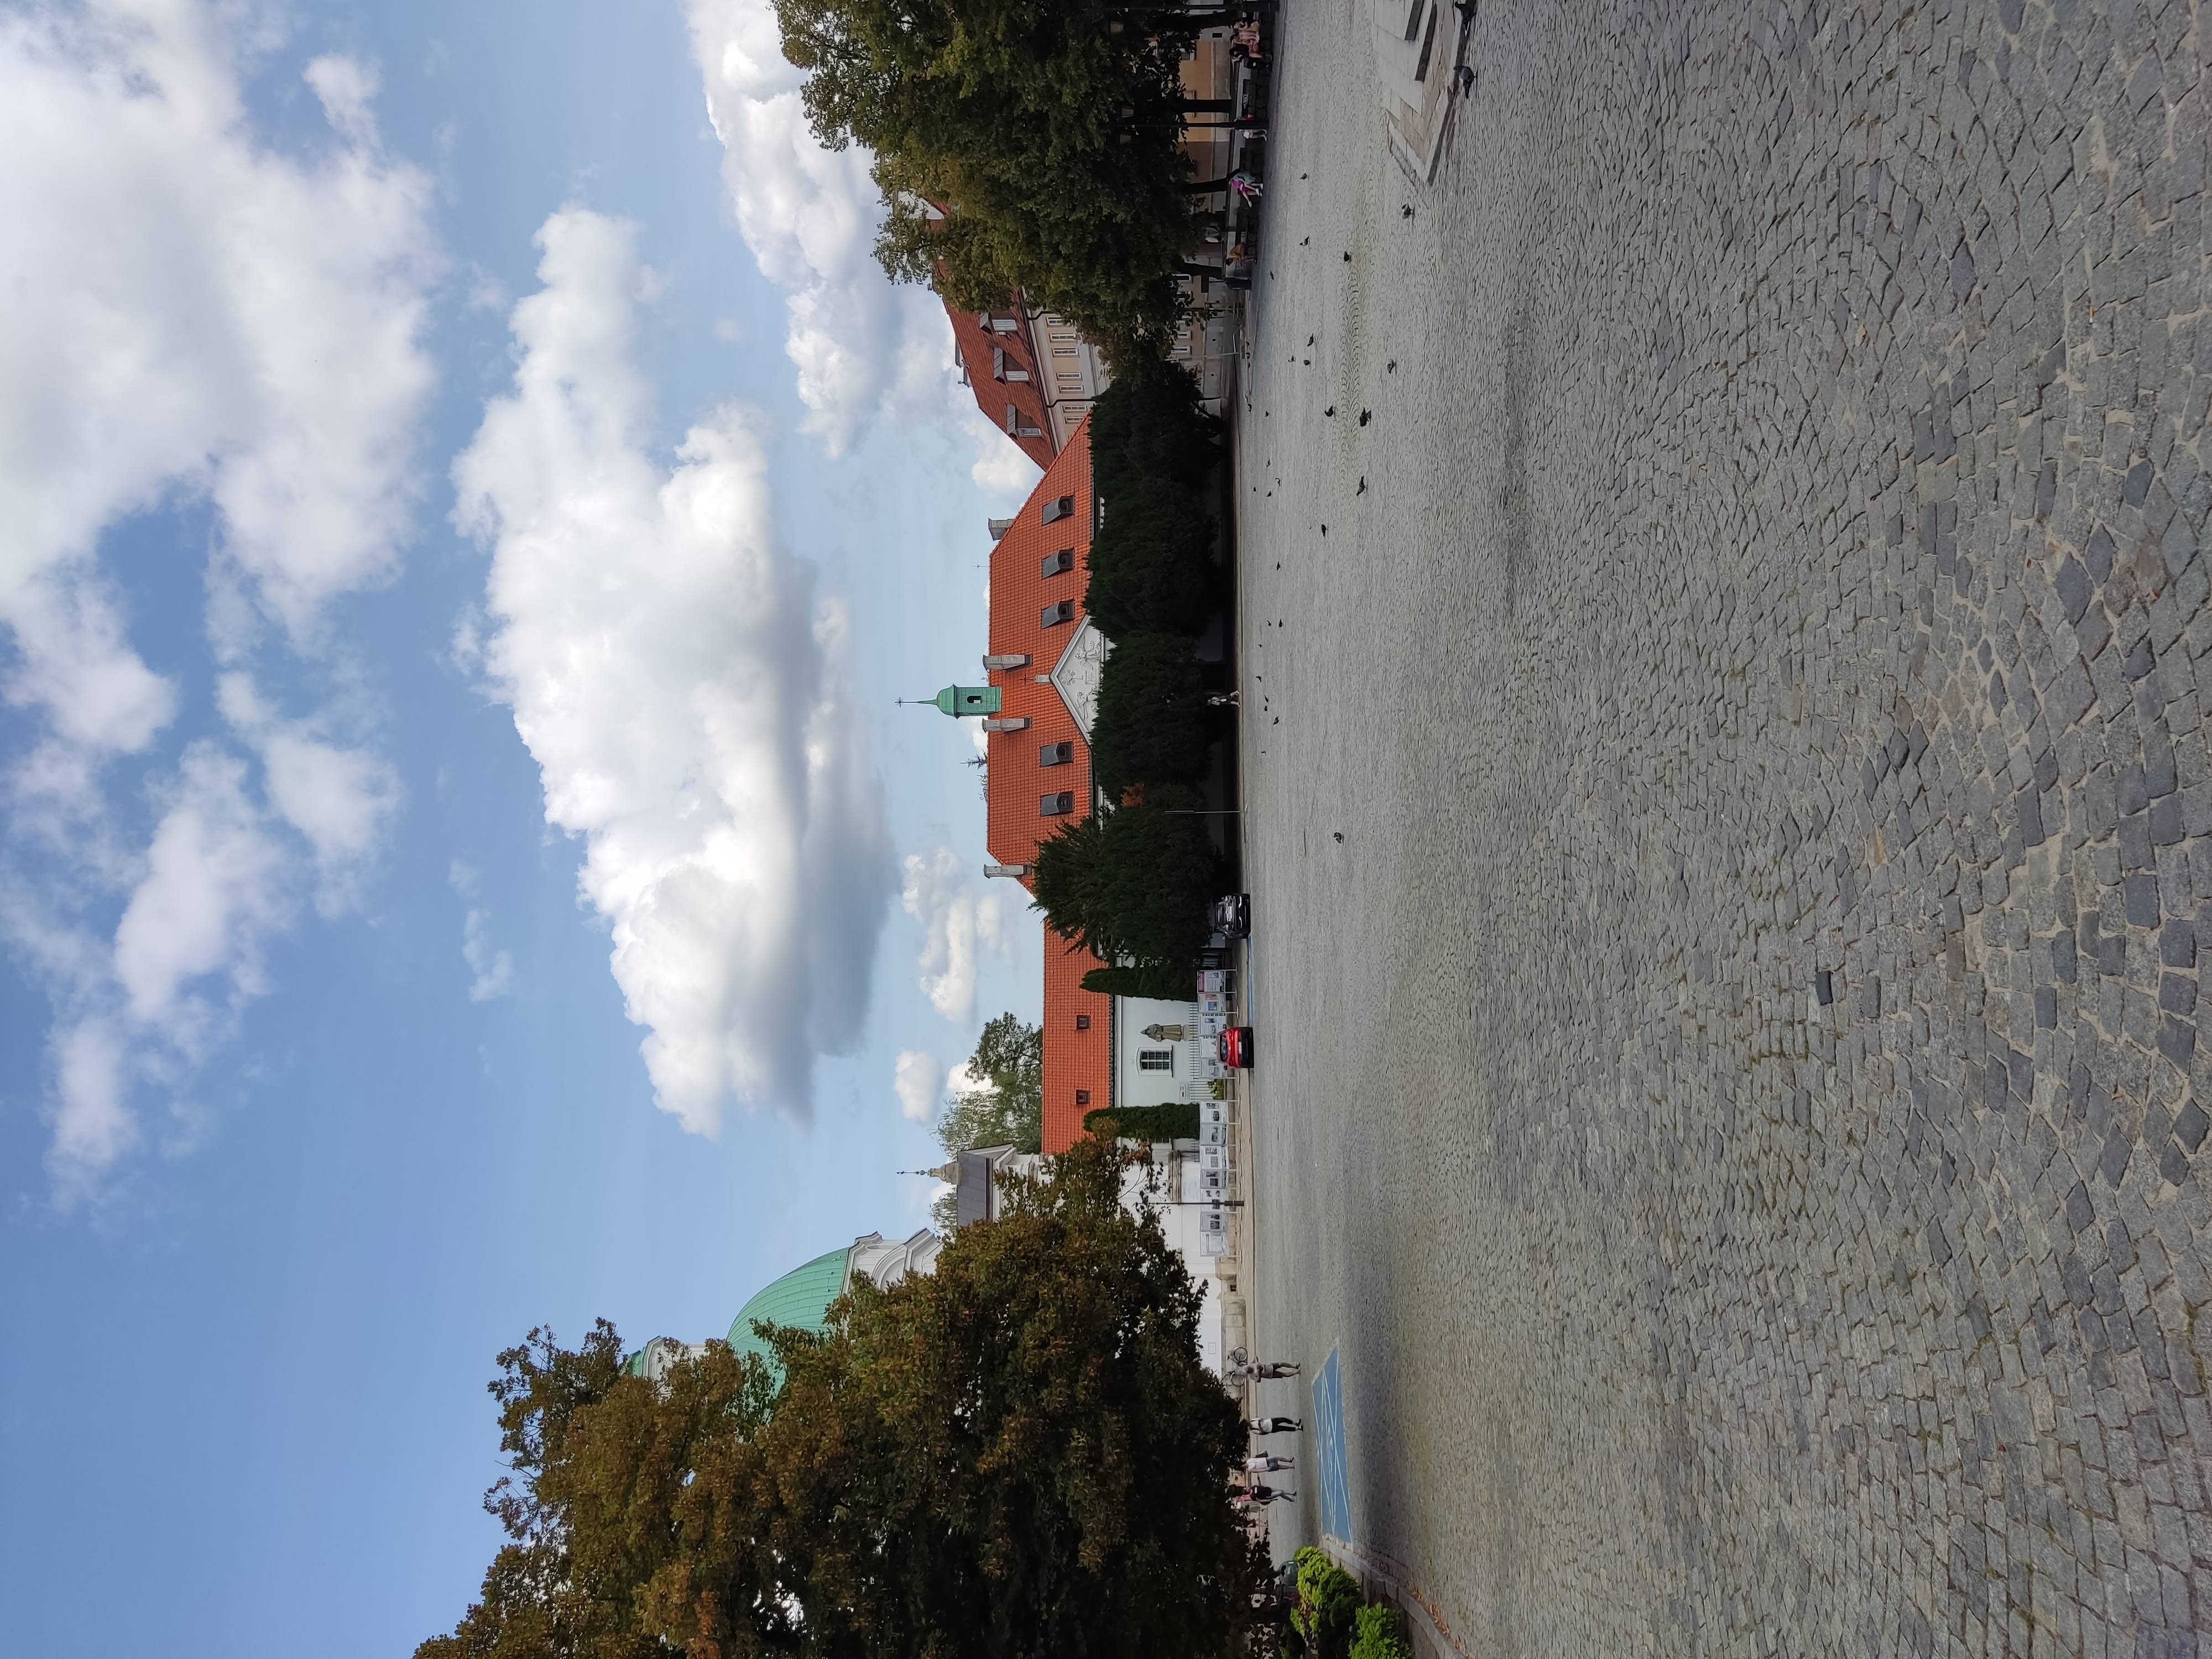
Nowe Miasto, formerly Nowa Warszawa, is a residential neighborhood in the Śródmieście district of Warsaw.


