Housing and utilities in the suburbs of Warsaw (Suburbs of Warsaw3)

Housing and utilities in the suburbs of Warsaw (Suburbs of Warsaw3)
We continue to publish articles about economic indicators and the state of the social sphere in the suburbs of the Polish capital. Data from the Polish General Statistics Office were used.
Materials for comparison are shown for the Warsaw Voivodeship and the Warsaw metropolitan region included in it, which includes Warsaw itself and 9 nearby counties and communes.
Cities included in the Warsaw Functional Region (WOF) are marked in grey. We have already talked about WOF itself.
The article includes the latest available data - as of the end of 2021.
Our third article is about the construction of housing and the development of public utilities in the cities that make up the suburbs of Warsaw.
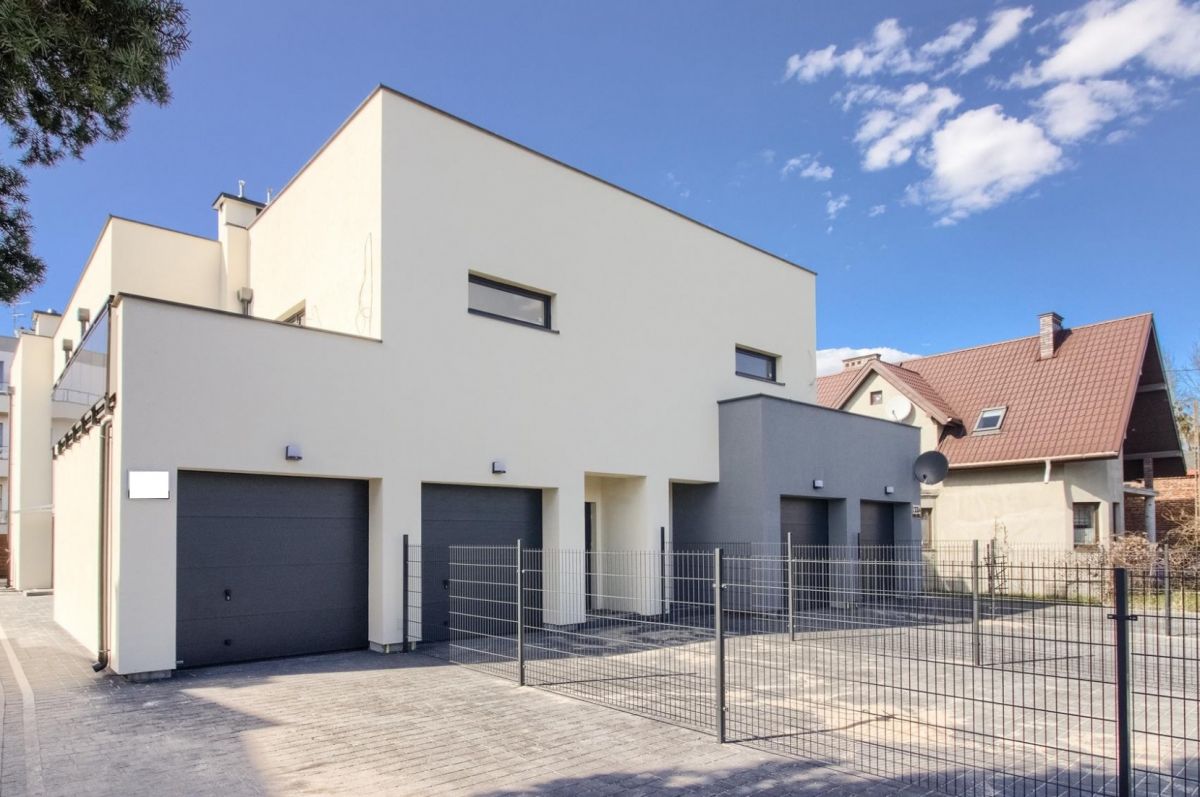
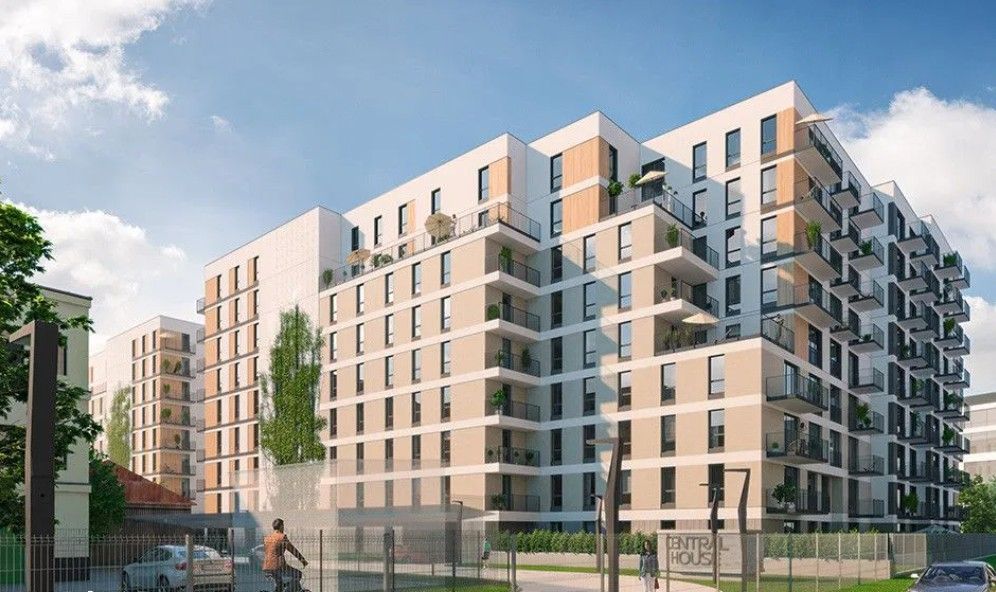
The largest number of apartments put into operation in 2021 (table 1) in the cities of Marki - 1132 apartments, Grodzisk Mazowiecki - 891, Piaseczno - 835, Ząbki - 668, Łomianki - 621, Radzymin - 470, Mińsk Mazowiecki - 468, Serock - 449 apartments .
We calculated the number of housing units delivered per 1000 population of suburban towns near Warsaw. It turned out that, in terms of per 1,000 inhabitants, the construction of houses and apartments in them is proceeding at the fastest pace in the cities of Serock (26.6 apartments per year per 1,000 inhabitants) and Marki (26.2 apartments). Other cities lag far behind. And yet, I would like to note the rather significant pace of housing construction in the cities of Grodzisk Mazowiecki - 16.7 apartments per year per 1000 residents, Łomianki and Radzymin 15.5 each, Ząbki 15.1 apartments.
As we can see, the largest number of apartments in absolute terms were built in these same cities.
The city of Sulejówek also looks quite good against this background - 13.9 apartments per 1000 people, Nowy Dwór Mazowiecki - 13.8, Mińsk Mazowiecki - 12.1 apartments.
There was practically no housing construction in such cities as Podkowa Leśna (only 7 apartments were delivered), Zakroczym (13), Kałuszyn (21), Mrozy (36).
Among large cities, we note the insufficient pace of housing commissioning in the cities of Pruszków (272 apartments per year per 65 thousand population or 4.4 apartments per 1000 inhabitants), Legionowo (279 apartments per 53 thousand inhabitants or 5.3 apartments), Wołomin (302 apartments per 51 thousand population or 5.9 apartments per 1000 inhabitants).
Now let’s compare the situation with housing construction in the capital of Poland and its suburbs. In 2021, 18,528 apartments were built in Warsaw, which is more than in all suburbs combined (14,514 apartments).
However, in the capital the rate of rented apartments per 1000 population is inferior to many provincial cities. 13 of them are ahead of the capital according to this criterion. This once again emphasizes the fact that housing construction is developing at an accelerated pace in the province.
The last indicator that we would like to analyze together with you in this regard is the size of the housing being rented. As you can see, if in Warsaw there is a tendency to build small-sized housing (the average area of one apartment in 2021 was only 64.8 square meters), then in provincial cities they are still building apartments “from the heart”, without saving on square meters. Well, for large families this is a good deal.
Only in 2 cities among the suburbs the area of apartments under construction is inferior to the capital, in the remaining 29 cities it exceeds it, and in some places it is quite significant. However, you can see this for yourself by looking at Table 1.
Table 1. Apartments commissioned in the suburbs of Warsaw in 2021
|
Apartments |
Rooms |
Usable area in square meters |
Population |
Apartments rented per 1000 population |
|||
|
Total |
including in private houses, in% |
apartments |
On average per 1 apartment |
||||
|
Warsaw Voivodeship |
44385 |
29,2 |
166138 |
4047362 |
91,2 |
5512794 |
8,1 |
|
Region Warsaw Metropolitan |
33042 |
18,9 |
115819 |
2840137 |
86,0 |
3248781 |
10,2 |
|
Capital city of Warsaw |
18528 |
3,5 |
52702 |
1199810 |
64,8 |
1863056 |
9,9 |
|
Povyat grodziski |
1316 |
43,7 |
5922 |
155095 |
117,9 |
103106 |
|
|
town Milanówek |
51 |
64,7 |
286 |
8108 |
159,0 |
16520 |
3,2 |
|
town Podkowa Leśna |
7 |
100,0 |
36 |
2201 |
314,4 |
3859 |
1,8 |
|
town Grodzisk Mazowiecki |
891 |
24,2 |
3526 |
90426 |
101,5 |
53496 |
16,7 |
|
Povyat legionowski |
1766 |
30,7 |
7550 |
188304 |
106,6 |
128837 |
|
|
town Legionowo |
279 |
12,5 |
999 |
21829 |
78,2 |
52995 |
5,3 |
|
town Serock |
449 |
30,3 |
1820 |
44824 |
99,8 |
16905 |
26,6 |
|
Povyat miński |
1431 |
51,5 |
5452 |
149336 |
104,4 |
158836 |
|
|
town Mińsk Mazowiecki |
486 |
8,4 |
1225 |
31279 |
64,4 |
40333 |
12,1 |
|
town Sulejówek |
296 |
26,0 |
1048 |
25663 |
86,7 |
21253 |
13,9 |
|
town Halinów |
137 |
93,4 |
681 |
20603 |
150,4 |
17984 |
7,6 |
|
town Kałuszyn |
21 |
100,0 |
105 |
2736 |
130,3 |
5566 |
3,8 |
|
town Mrozy |
36 |
100,0 |
177 |
4859 |
135,0 |
8646 |
4,2 |
|
Povyat nowodworski |
609 |
42,5 |
2458 |
55807 |
91,6 |
79751 |
|
|
town Nowy Dwór Mazowiecki |
353 |
9,3 |
1078 |
21909 |
62,1 |
28586 |
13,8 |
|
town Nasielsk |
59 |
96,6 |
317 |
7347 |
124,5 |
19374 |
3,0 |
|
town Zakroczym |
13 |
100,0 |
65 |
1672 |
128,6 |
5954 |
2,2 |
|
Povyat otwocki |
641 |
72,4 |
3369 |
89881 |
140,2 |
126449 |
|
|
town Józefów |
145 |
63,4 |
785 |
21571 |
148,8 |
20998 |
6,9 |
|
town Otwock |
133 |
55,6 |
656 |
17456 |
131,2 |
44333 |
3,0 |
|
town Karczew |
59 |
100,0 |
329 |
9223 |
156,3 |
15868 |
1,33 |
|
Povyat piaseczyński |
2138 |
40,7 |
9736 |
261316 |
122,2 |
209443 |
|
|
town Góra Kalwaria |
232 |
61,2 |
1073 |
28578 |
123,2 |
28218 |
8,2 |
|
town Konstancin-Jeziorna |
123 |
70,7 |
632 |
23741 |
193,0 |
25165 |
4,9 |
|
town Piaseczno |
835 |
33,3 |
3508 |
94025 |
112,6 |
95740 |
8,7 |
|
town Tarczyn |
119 |
76,5 |
622 |
16860 |
141,7 |
12209 |
9,8 |
|
Povyat pruszkowski |
1373 |
45,4 |
6754 |
184662 |
134,5 |
177193 |
|
|
town Piastów |
45 |
60,0 |
279 |
7666 |
170,4 |
23140 |
1,9 |
|
town Pruszków |
272 |
17,6 |
1041 |
25484 |
93,7 |
65333 |
4,2 |
|
town Brwinów |
336 |
38,4 |
1417 |
34494 |
102,7 |
29643 |
11,4 |
|
Povyat warszawski zachodni |
1700 |
37,3 |
7330 |
191748 |
112,8 |
131550 |
|
|
town Błonie |
117 |
77,8 |
551 |
14299 |
122,2 |
22147 |
5,3 |
|
town Łomianki |
621 |
18,5 |
2256 |
53750 |
86,6 |
30939 |
15,5 |
|
town Ożarów Mazowiecki |
338 |
29,0 |
1489 |
38252 |
113,2 |
30129 |
11,2 |
|
Povyat wołomiński |
3540 |
25,8 |
14546 |
364178 |
102,9 |
270560 |
|
|
town Kobyłka |
323 |
22,3 |
1467 |
35715 |
110,6 |
27580 |
11,7 |
|
town Marki |
1132 |
8,1 |
4332 |
108395 |
95,8 |
43164 |
26,2 |
|
town Ząbki |
668 |
5,1 |
2074 |
48135 |
72,1 |
44325 |
15,1 |
|
town Zielonka |
212 |
8,5 |
661 |
17042 |
80,4 |
18179 |
11,6 |
|
town Radzymin |
470 |
36,2 |
2103 |
53572 |
114,0 |
30302 |
15,5 |
|
town Tłuszcz |
136 |
90,4 |
766 |
19270 |
141,7 |
20087 |
6,8 |
|
town Wołomin |
302 |
56,6 |
1496 |
40024 |
132,5 |
51396 |
5,9 |
Next we show the state of water supply and sewerage networks in the suburbs of Warsaw (Table 2). Perhaps only one indicator is subject to interpretation here - water consumption per person. Focusing on the capital, it should be said that water consumption in the suburbs still lags behind Warsaw indicators. If in Warsaw the consumption per person is 43.3 m3, then only in 2 cities (Ożarów Mazowiecki - 45.5 m3, Konstancin-Jeziorna 43.7 m3) this figure exceeds the capital. Close to Warsaw's water consumption are the cities of Góra Kalwaria 42.4 m3, Tarczyn 41.0 m3. Other cities lag behind in water consumption.
Table 2. Water supply and sewerage networks in the suburbs of Warsaw in 2021
|
Distribution network, km |
Water supplied to households, dam3 |
Water consumption from the water supply system in households per capita in m3 |
Discharge of wastewater through sewerage, dam3 |
||
|
water supply |
sewerage* |
||||
|
status as of December 31 |
|||||
|
Warsaw Voivodeship |
47270,1 |
17751,0 |
209920,1 |
38,1 |
231664 |
|
Region Warsaw Metropolitan |
13785,7 |
8813,5 |
127407,1 |
39,3 |
165723 |
|
Capital city of Warsaw |
2917,5 |
2586,5 |
80575,9 |
43,3 |
107357 |
|
Povyat grodziski |
1077,3 |
484,9 |
3562,0 |
34,8 |
3234 |
|
town Milanówek |
100,5 |
70,4 |
575,3 |
34,8 |
694 |
|
town Podkowa Leśna |
44,3 |
47,1 |
153,9 |
39,9 |
200 |
|
town Grodzisk Mazowiecki |
357,3 |
179,2 |
1831,7 |
34,6 |
2002 |
|
Povyat legionowski |
651,1 |
415,1 |
3562,2 |
27,8 |
5009 |
|
town Legionowo |
129,4 |
140,1 |
1841,4 |
34,7 |
3024 |
|
town Serock |
230,7 |
77,8 |
611,9 |
36,7 |
604 |
|
Povyat miński |
1953,3 |
735,0 |
5531,7 |
34,9 |
4259 |
|
town Mińsk Mazowiecki |
115,4 |
119,7 |
1421,7 |
35,2 |
1740 |
|
town Sulejówek |
127,8 |
125,5 |
745,7 |
35,1 |
815 |
|
town Halinów |
189,6 |
104,5 |
575,8 |
32,2 |
477 |
|
town Kałuszyn |
91,0 |
20,3 |
200,8 |
35,9 |
80 |
|
town Mrozy |
141,3 |
64,5 |
289,5 |
33,4 |
195 |
|
Povyat nowodworski |
956,0 |
362,8 |
2744,1 |
34,4 |
2859 |
|
town Nowy Dwór Mazowiecki |
81,5 |
94,0 |
1031,4 |
36,0 |
1630 |
|
town Nasielsk |
358,3 |
54,0 |
687,5 |
35,4 |
493 |
|
town Zakroczym |
154,0 |
14,1 |
208,4 |
34,9 |
101 |
|
Povyat otwocki |
1115,8 |
548,6 |
3831,1 |
30,3 |
4071 |
|
town Józefów |
150,3 |
147,2 |
514,2 |
24,4 |
803 |
|
town Otwock |
216,0 |
178,1 |
1252,8 |
28,2 |
1733 |
|
town Karczew |
100,5 |
35,5 |
506,8 |
31,8 |
922 |
|
Povyat piaseczyński |
1655,9 |
1187,2 |
8318,5 |
40,0 |
12236 |
|
town Góra Kalwaria |
228,1 |
108,5 |
1191,0 |
42,4 |
814 |
|
town Konstancin-Jeziorna |
183,6 |
166,4 |
1103,3 |
43,7 |
1594 |
|
town Piaseczno |
598,2 |
486,9 |
3706,8 |
38,9 |
6493 |
|
town Tarczyn |
249,0 |
36,6 |
498,0 |
41,0 |
388 |
|
Povyat pruszkowski |
868,4 |
853,3 |
6577,9 |
37,2 |
8974 |
|
town Piastów |
58,7 |
65,1 |
689,6 |
29,7 |
917 |
|
town Pruszków |
124,5 |
128,7 |
2430,1 |
37,2 |
3099 |
|
town Brwinów |
210,7 |
206,9 |
937,4 |
31,7 |
1218 |
|
Povyat warszawski zachodni |
1167,0 |
764,1 |
5091,4 |
38,9 |
6893 |
|
town Błonie |
188,1 |
152,1 |
877,0 |
39,7 |
1094 |
|
town Łomianki |
208,2 |
147,3 |
865,4 |
28,2 |
1062 |
|
town Ożarów Mazowiecki |
231,1 |
87,4 |
1357,0 |
45,5 |
2660 |
|
Povyat wołomiński |
1423,4 |
876,0 |
7612,3 |
28,3 |
10831 |
|
town Kobyłka |
103,0 |
95,3 |
865,5 |
31,6 |
972 |
|
town Marki |
147,7 |
218,7 |
1420,6 |
33,4 |
1835 |
|
town Ząbki |
89,3 |
85,5 |
1383,7 |
31,5 |
4623 |
|
town Zielonka |
63,8 |
67,9 |
574,8 |
31,6 |
653 |
|
town Radzymin |
186,2 |
125,1 |
780,6 |
25,9 |
660 |
|
town Tłuszcz |
118,1 |
34,2 |
320,3 |
15,9 |
232 |
|
town Wołomin |
217,3 |
158,5 |
1522,2 |
29,6 |
1524 |
|
* Including collectors |
|||||
Blog


Real estate prices in Warsaw in November 2023
Real estate prices in Warsaw in November 2023


